How We Made It: School Protests in Africa
School Protests in Africa is a dynamic digital scholarship project whose central premise revolves around resurfacing the frequency and prevalence of modern youth-led protests in Africa.

______________
Project Title: School Protests in Africa
Faculty Lead: Krystal Strong (GSE)
RDDS Leads: Jennifer Garcon, Scott Enderle, Cassandra Hradil
______________
School Protests in Africa is a dynamic digital scholarship project whose central premise revolves around resurfacing the frequency and prevalence of modern youth-led protests in Africa. Seeking to make a significant contribution to the body of emergent scholarship examining the relationship between school and contemporary activism, this time centered on the continent, Krystal Strong, Ph.D. Assistant Professor of Literacy, Culture and International Education in Penn GSE launched a 15-month research project to collect the much-needed empirical perspective on Africa to the scholarship on global youth and student activism. The data collection was geared toward answering the following guiding questions: “what is the frequency of incidences of protests in educational institutions in Africa?” and “what are their explicit causes as defined by the participants?” Strong and her project partner, Ph.D. candidate Jimil Ataman, used both archival research and web-based data aggregation tools including Google, Facebook, and Twitter API to build a cross-national database of school-based protests in Africa since 2000.
Armed with a robust database--a compilation of over 1000 incidents of protest--Strong and Ataman approached the Research Data and Digital Scholarship team wanting to use the database to identify patterns that might exist within and across the Continent. The resulting partnership produced the School Protests in Africa digital scholarship project, which drew on the archival and geospatial data collected by Krystal’s team to create a series of maps and visualizations aimed at synthesizing the research results and enhancing the interoperability of the database to create new data related to youth and student activism in Africa.
Want to know how we built this? Here’s how.
Through a series of conversations and consultations, we worked with Strong and her team to identify central components of the database and ideate ways to best render them within a digital interface. These conversations allowed us to determine a few key priorities of the proposed digital project:
- The project needed to treat the continent both holistically, and as 54 discrete countries with historical and social precedents that both underscored and contextualized protest actions.
- The project would need to be accessible to users outside of the US, where the collated data could have the greatest impact on advocacy.
- The project was envisioned as being “in process”, meaning that the database was expected to grow as the research project continued.
These priorities posed both technological and pedagogical challenges for the Digital Scholarship Team, and we decided to respond to their needs in the following way.
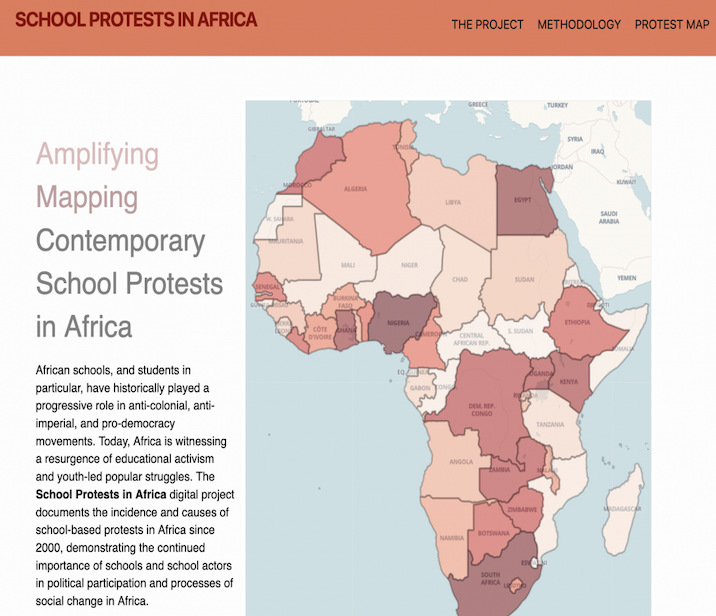
The SPA site is built upon two separate yet interoperable map views. One is a country-level map of the continent which uses geo-temporal signatures to communicate the volume of school protest actions from a continent-wide view. Want to know which country has the most incidences of protest? Deepening color contrast--pulling from the location data--help indicate that (at present), it’s Nigeria. As the database grows--through additional research and participatory data collection, so too will the visual markers indicating frequency of activism. Click on a country, and you get the historical context of that country, graphs indicating the number of events over time, and a visualization showing the location of events. Are events more concentrated in the countryside, or near large cities? Here’s where you’d go to find out.
The second map view visualizes over 1000 protest events across the continent, allowing users to filter through protest events based on pre-assigned filters, including geographic context, location, causes, and actors involved. The ability to layer filtered results surfaces patterns across the continent regarding the type of activism that emerged. As you explore the map, results update in real time, allowing the user to begin to see geospatial patterns to the data that they are filtering. The functionality introduced by the fiters enables users to engage more fully with the database itself, overlaying filters in ways that can generate new insight about the continuity and contrast of youth activism, its causes, and its outcome both across the continent and over time.
The real-time response of the map makes the project appear dynamic, but it's built using open-sourced static site platforms including Bokeh and Jekyll, with some Python and JavaScript for additional functionality. While designing components of the site, the RDDS team sought to strike a balance between rich interactivity and long-term preservability. The project takes a data-first approach, and considers preservability, sustainability, and archivability key goals of the scholarly endeavor to document incidences of oft-ignored youth-led activism. Our framework engages minimal computing principles, which enables the project to remain agile by consolidating interactive components of the digital artifact (ie. the site) into a single, self-contained file -- including the code and the data itself.
The use of Bokeh and Jekyll for the bulk of the project’s infrastructure recognizes that users might be accessing the project on limited bandwidth devices such as cell phones and tablets. This minimal computing backbone uses the well-structured database to pre-generate website pages. Moreover, an ongoing (and accompanying) web-archiving subproject endeavors to preserve the records of student protests as reported by local new media, by scrapping and archiving primary source research from which the database entries are drawn.
